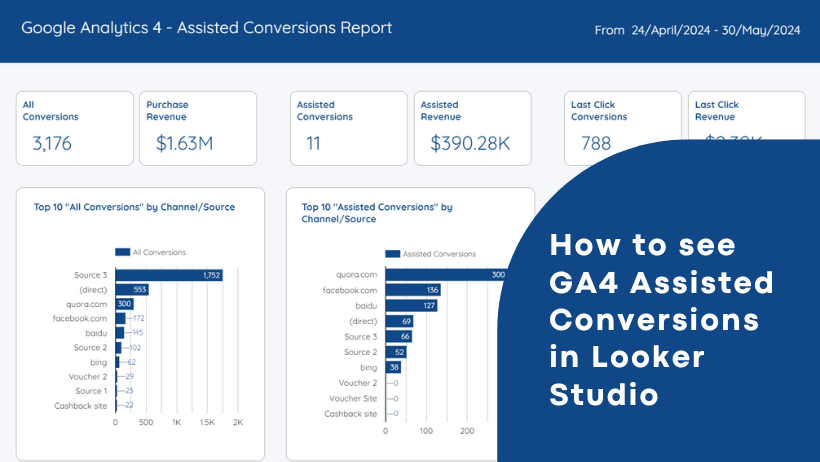
If you use Google Analytics 4 (GA4) to get valuable insights about your website. You’ve likely come across different reports that help you understand your user data.
One crucial report for understanding your conversion data is the Attribution Paths report. Attribution Paths report show you the various touchpoints that occur before a conversion.
So, when a conversion occurs on your website — Google Analytics attributes credit to each path that led to that conversion. And the principle that determines how much credit each interaction gets for your conversions is called Attribution Model.
Currently, in GA4, there are three different attribution models available:
Data-driven attribution: This model distributes credit for conversions based on your specific data. It calculates the actual contribution of each interaction using data from your account.
Paid and organic last click: This model ignores direct traffic. And attributes 100% of the conversion value to the last channel the customer clicked through before converting.
Google paid channels last click: This model attributes 100% of the conversion value to the last Google Ads channel the customer clicked through before converting. If no Google Ads click is present, it defaults to the paid and organic last click model.
For a successful marketing campaign, it’s important to know which traffic sources bring the most conversions. That’s where the Attribution Paths report comes in handy.
This report can help you answer questions like:
- How many times did search campaigns help in conversions?
- Which channel is most valuable as the last interaction?
- How many days/touchpoints does it take for the average customer to convert?
Attribution Paths reports also help you measure a crucial metric which is Assisted Conversions.
In this blog, I’ll show you how to see Assisted Conversions in Looker Studio using Google Sheets.
What are Assisted Conversions?
Assisted conversions are touchpoints or interactions that lead up to a conversion. But they are not the final touchpoint that resulted in the conversion.
In other words, assisted conversions give credit to every touchpoint in a user’s path except for the final source.
These touchpoints play a vital role in a user’s journey. Because a user interacts with them before finally deciding to convert. These touchpoints can include channels like paid search, social media, email, and more.
For example, if a user first clicks on a Google ad. Then visits your site through a Facebook post. And finally converts after clicking a promotional email. Then Google ad and Facebook post are considered as assisted conversions.
In GA4, assisted conversions are part of the Attribution Path reports. But, direct integration of attribution data from GA4 to Looker Studio isn’t currently available.
GA4 also does not make this data available in its API. So an automated solution to Google Sheets isn’t possible at this stage too. As a result, you need to employ workarounds to visualize this data.
In the first step we will get this data into Google Sheet. So we can create a report in Looker Studio with this data.
How to Get Assisted Conversions Data into Google Sheet
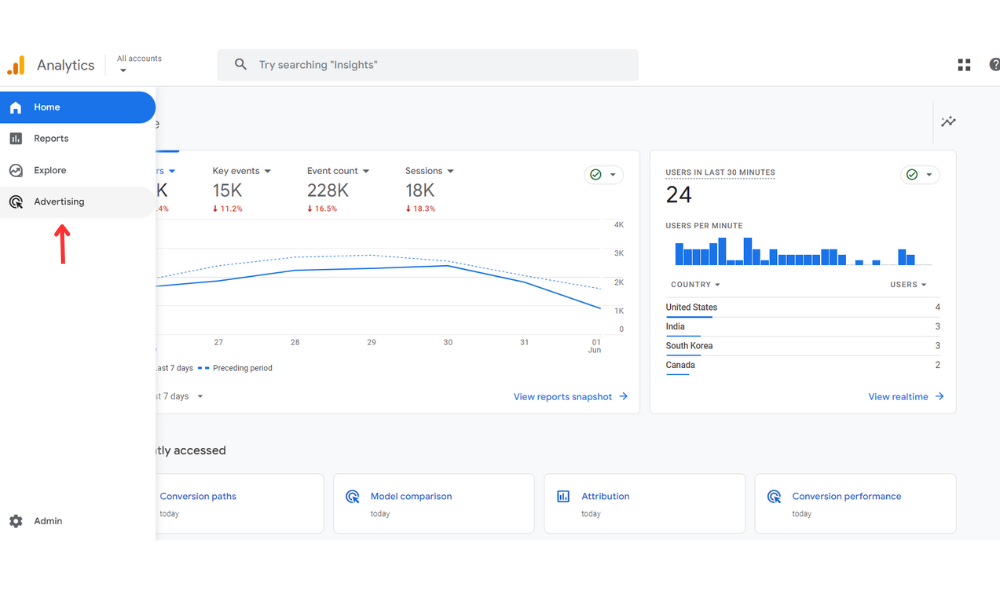
1. Go to the “Advertising Section”
First, log in to your GA4 account. Once you’re in, go to the “Advertising” section.
2. Choose "Attribution Paths" and Set Your Date Range
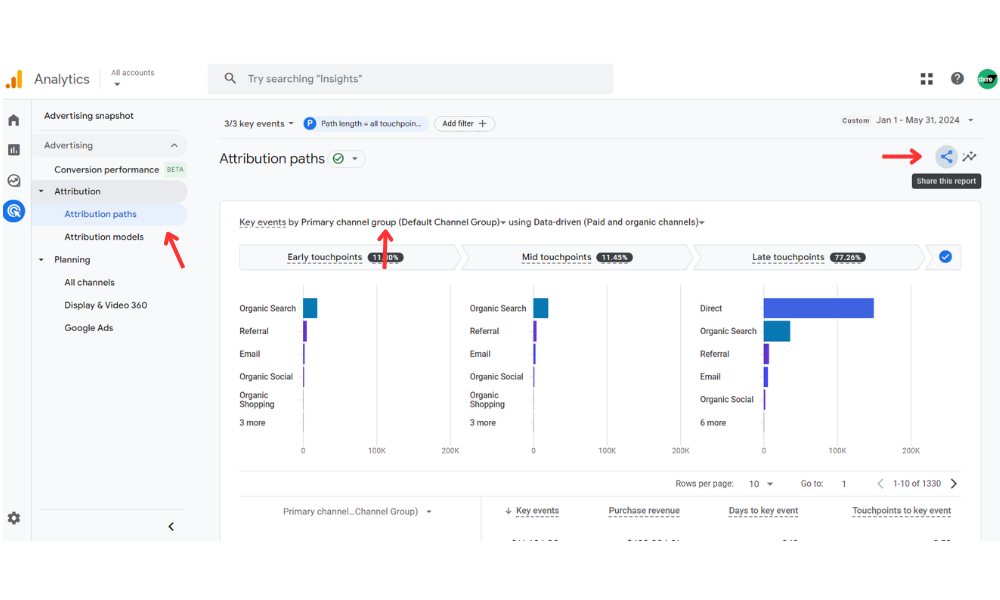
In the Advertising section, find and select “Attribution Paths.” This report shows the sequence of interactions (events) leading to conversions. Make sure to set the date range that you want to analyze.
3. Change "Default Channel Grouping" to "Source," "Medium," or "Campaign"
Instead of using the default channel grouping, switch to “Source,” “Medium,” or “Campaign.” This allows for a more detailed and customized view of your data. Start with “Source” to see where your traffic is coming from.
Note: Whenever Google Analytics cannot determine the origin of your website traffic, it is most likely to report ‘(direct)’ as your website source.
4. Extract the Data
You’ll need to export this data to view both conversions and assisted conversions.
Click on the share icon at the top right of the screen.
Select “Download file” and choose either “Export to Google Sheets” or “Download CSV.”
5. Open the Data in Google Sheets or Excel
Once downloaded, open the file in Google Sheets or Excel. The data should be formatted and ready for further manipulation.
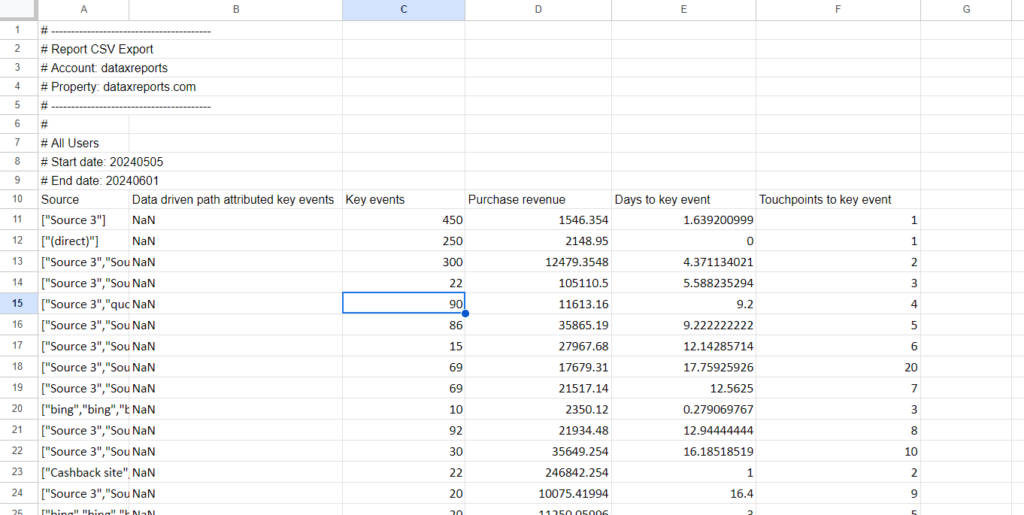
This is how the data will look once you have exported it and opened it in Excel or Google Sheets:
Note: In Google Analytics 4, Conversions are now called key events. So in some place you will see Key Events written, don’t get confused its just conversions in GA4.
6. Use a Google Sheets Template for Assisted Conversions
Use this pre-made Google Sheets template, designed to display all conversions, including assisted conversions.
Get this template and make your own copy by clicking on File -> Make a Copy.
7. Approve the Apps Script Pop-up
Use this pre-made Google Sheets template, designed to display all conversions, including assisted conversions.
Get this template and make your own copy by clicking on File -> Make a Copy.
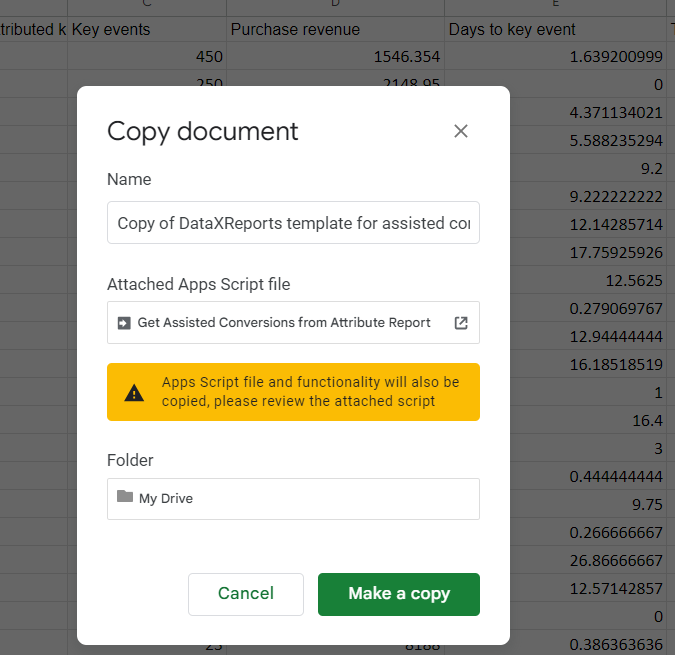
8. Navigate to the "Attribution Data" Sheet
Switch to the “Attribution Data” sheet at the bottom of the screen. This is where you’ll paste your downloaded data.
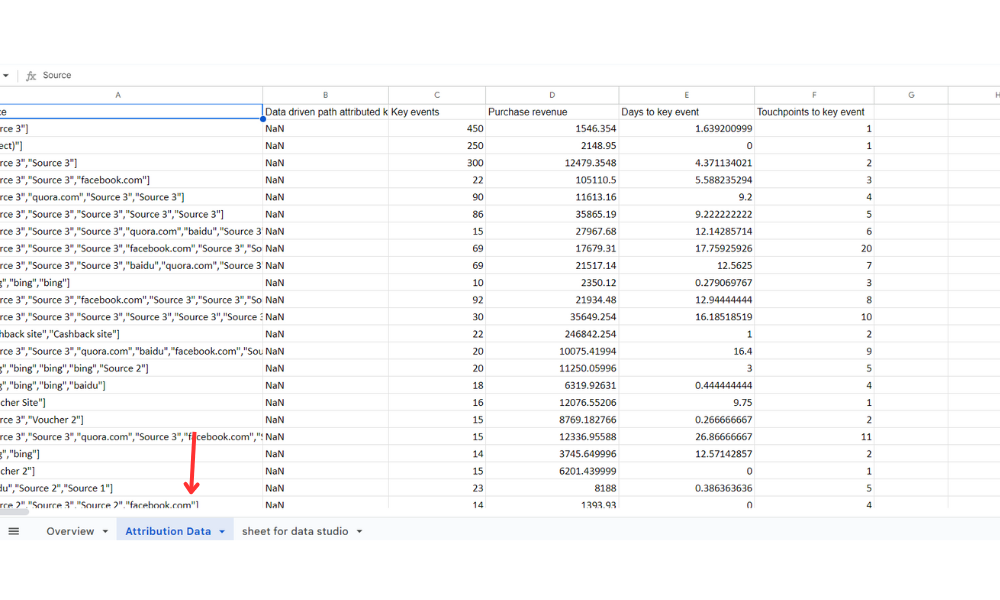
9. Add Your Data to the "Attribution Data" Sheet
Open the CSV file you downloaded from GA4. Copy the data starting from cell A10 and paste it into the “Attribution Data” sheet in cell A1 of the Google Sheet. Replace the existing dummy data.
10. Review Your Insights on the Overview Sheet
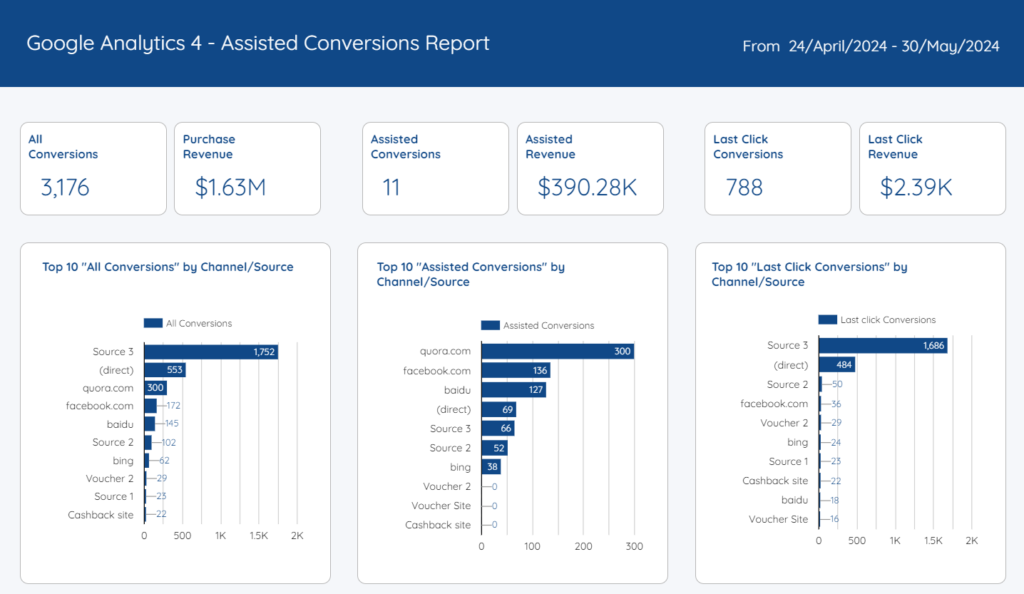
The formulas in the template will automatically update. You’ll see all conversions for the sources, mediums, or campaigns you’ve added. Including total conversions, revenue, assisted conversions, and last-click conversions.
Final Steps to View Your Assisted Conversion Report in Looker Studio
Copy the Looker Studio Template
To get this data into Looker Studio, you need to copy a report template. Follow these steps:
Open the Looker Studio template for Assisted Conversions. The report will look something like this.
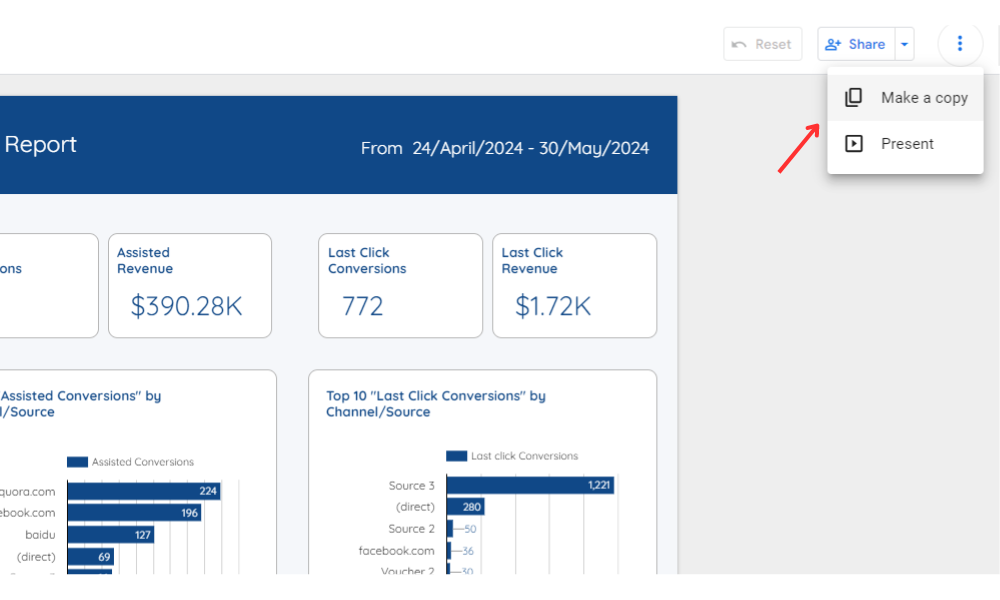
2. Click on the three dots on the upper right corner in the template and select “Make a copy.”
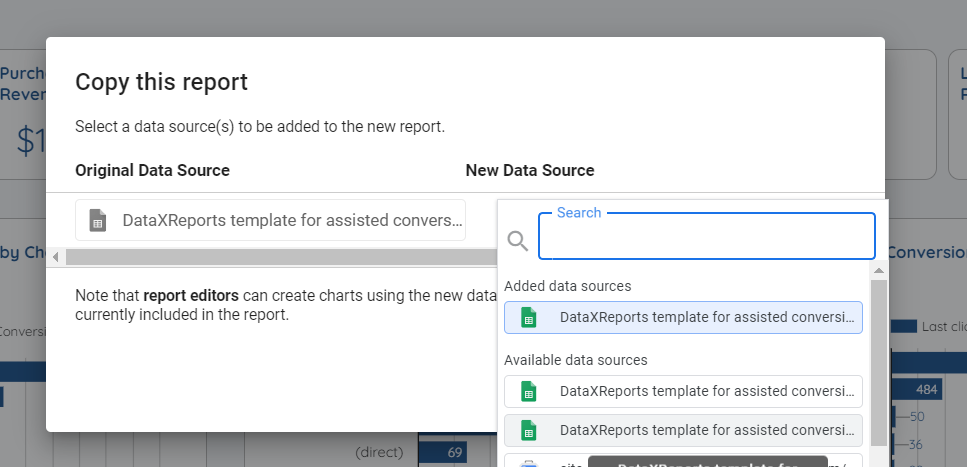
3. A popup called “Copy this report” will appear. Click on the dropdown under “New data source” and select “Create data source.”
4. Choose “Google Sheet” as the data source.
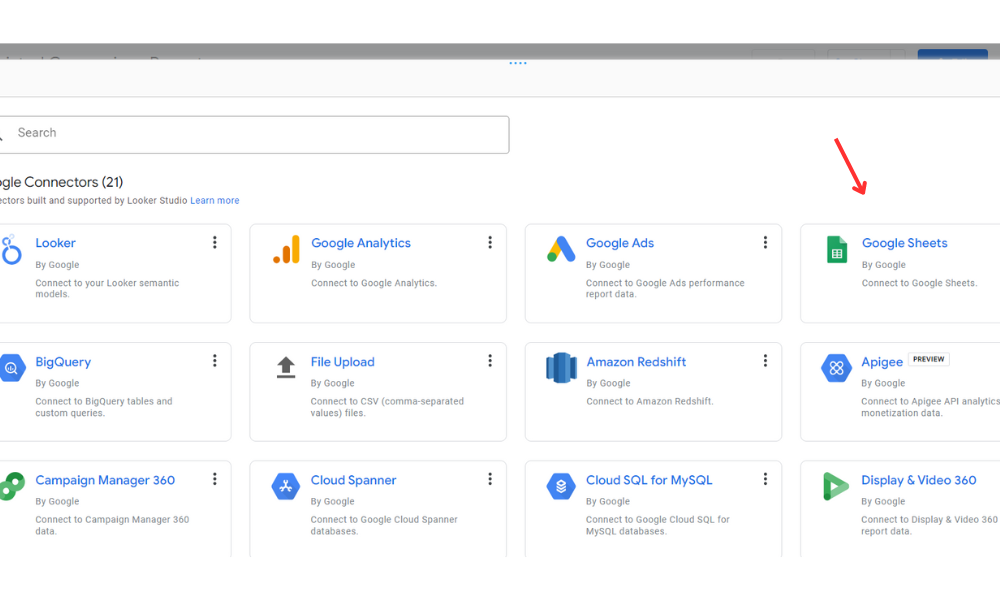
5. In the Google Sheet connector, select the spreadsheet you created. Under the worksheet, select “Sheet for data studio.” Leave the options as they are and click “Connect.”
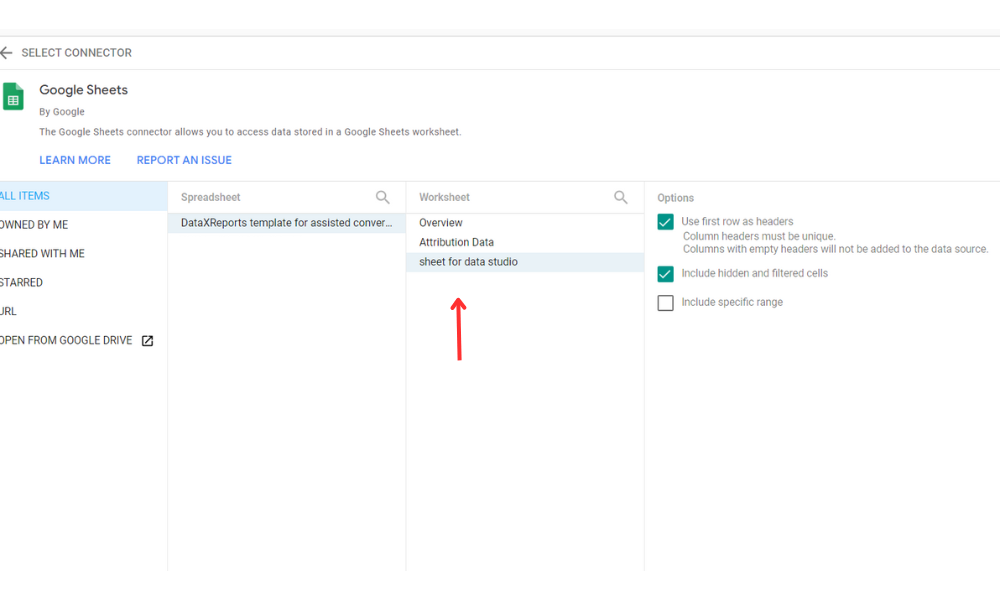
6. After connecting the data source, you will see the available fields for your report. For all the revenue fields (assisted, purchase, last click), click on “Number” and change the metric type to “Currency” by selecting your currency value.
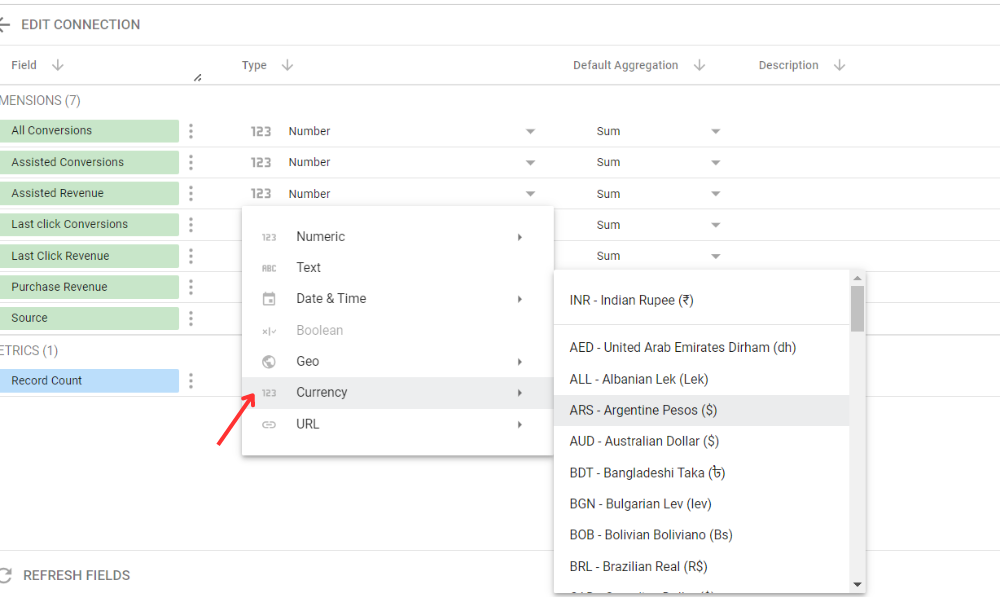
7. Click “Add to report.”
8. Now Under “New data source,” you will see your spreadsheet name. Select the sheet and click “Copy report.”
Final Steps to Complete your Looker Studio Report
Now that you have your data source connected, you will see the Assisted Conversion Report in Looker Studio. Follow these final steps:
Update the Date Range: First, update the date range in the report header to match the date range of the Attribution Paths report you downloaded from GA4. Click on the date in the header and set the correct date range.
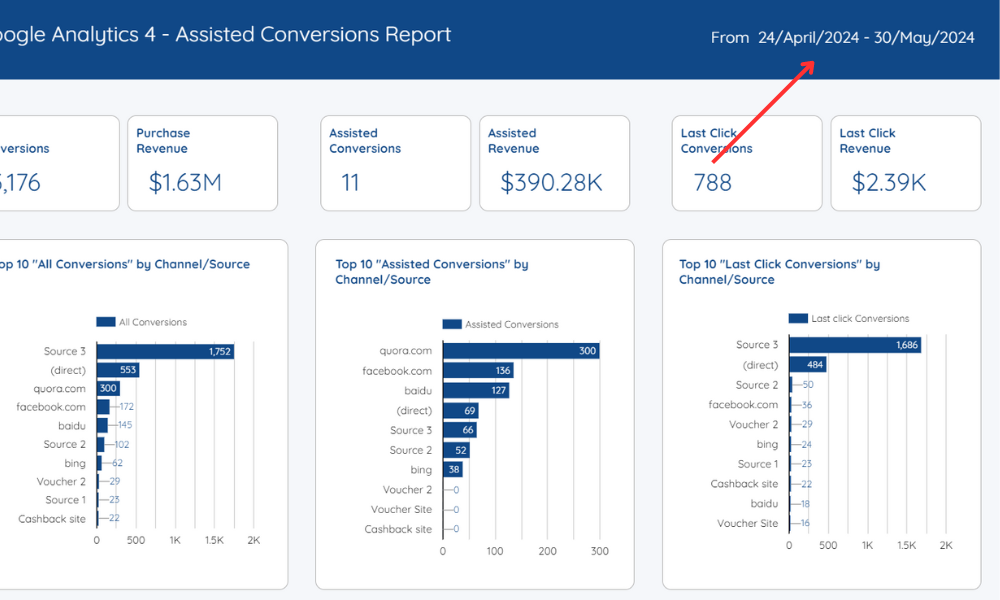
2. Interact with the Report: With the date range updated, your report is ready. You can now interact with it and analyze the data.
3. Share with Clients: Once everything is set up, you can share the report with your clients to provide them with insights into assisted conversions and the overall performance of your marketing efforts.
By following these steps, you can effectively analyze assisted conversions from GA4 in Looker Studio, gaining valuable insights into your marketing efforts.
If you encounter any issues with the template or need help interpreting the insights, feel free to reach out to me at my email address rajeev@dataxreports.com or contact us by filling the contact form.
