Custom Dashboard Reporting Services

We can simplify your data with custom dashboards and reports using Looker Studio.

Unlock the full potential of your data with our tailor-made dashboards in Looker Studio.

Effortlessly combine data from Google Sheets, Big Query, Google Analytics 4 and other sources to get real-time, actionable insights that drive smart business decisions.

Visualize everything from marketing performance to financial metrics in a clear, easy-to-understand format.

Looker Studio Report Example

What is Looker Studio?

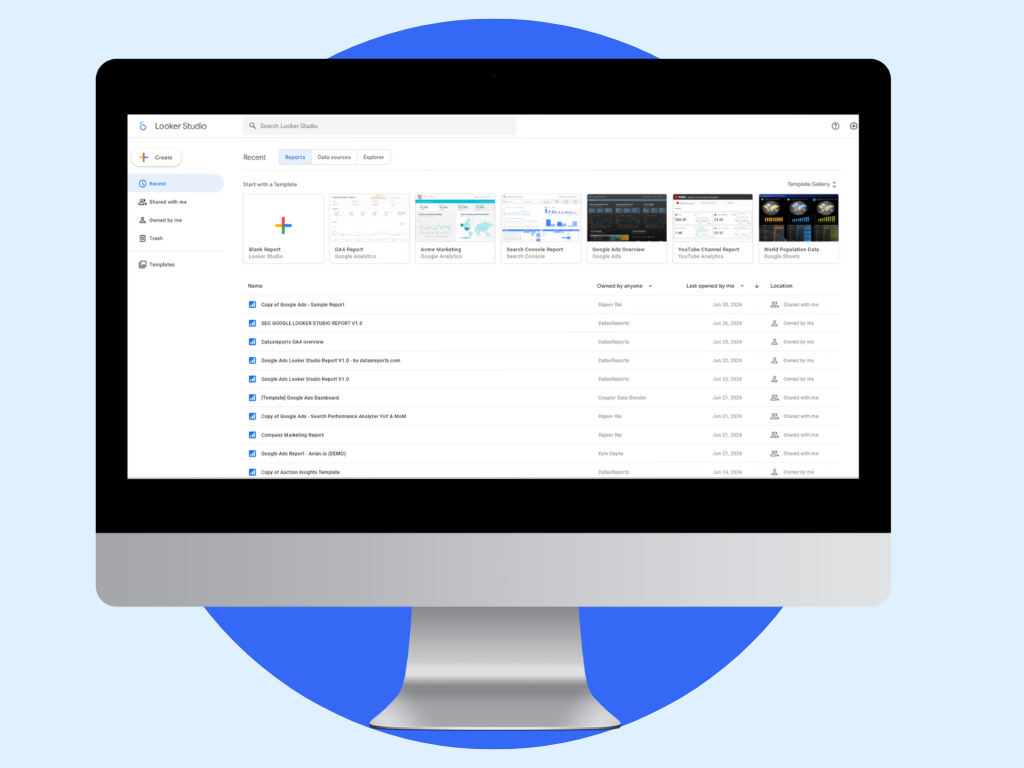
Looker Studio is a powerful tool by Google for creating shareable, customizable, and interactive reports and dashboards.
 
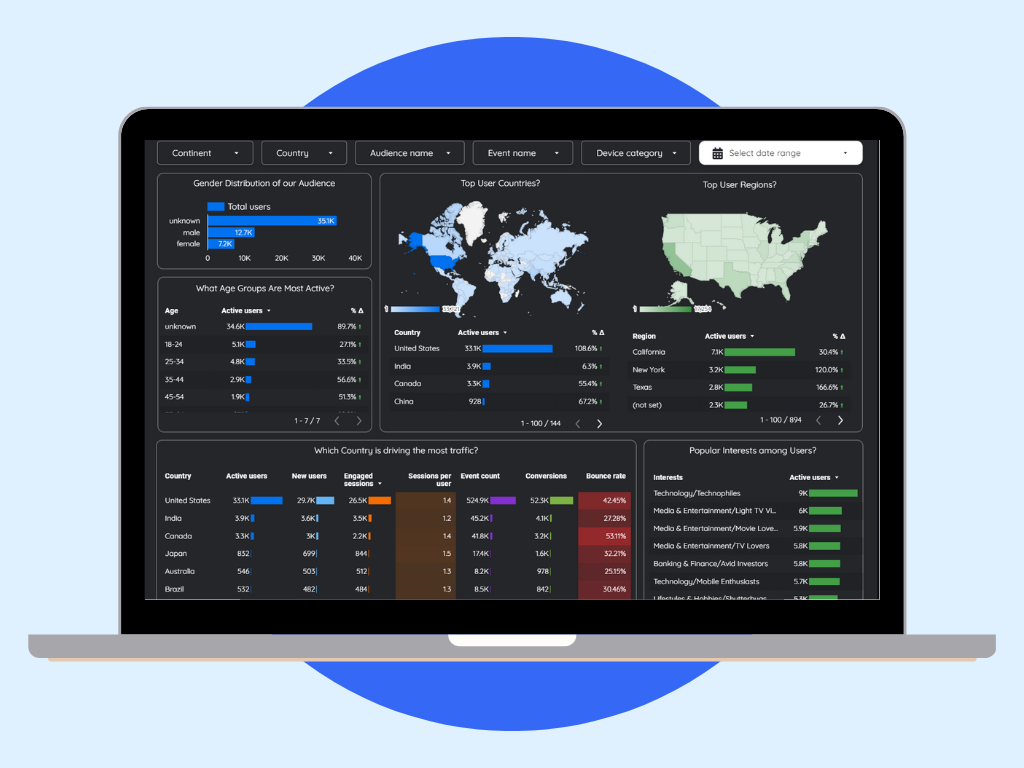
You can pull in data from up to 10+ different sources, including Google Analytics, Big Query, Google Sheets, etc. With graphs, widgets, charts, and maps, you can easily visualize your data in reports that fit your needs.
 
Looker Studio helps businesses make quicker, better decisions for improved results.

Key Features:

Looker studio dashboard services

BASIC PLAN

For small teams needing a simple overview of their data.

$200/month

PROFESSIONAL PLAN

For Growing teams wanting detailed and frequent insights.

$400/month

ENTERPRISE PLAN

Large organizations needing comprehensive, real-time data across multiple departments.

$700/month

Types of Dashboards

No matter the type of data visualization that you need, we can help you get a handle on all of your data sets and business dashboard demands.

Executive Dashboard

Overview key metrics in real-time to make strategic decisions. Visualize performance, goals, and trends at a glance, streamlining your executive review process.

Finance Dashboard

Track financial health with up-to-date revenue, expenses, and profit data. Simplify financial reporting and quickly identify areas for cost savings and growth.

Marketing Dashboard

Analyze marketing campaign performance with metrics on leads, conversions, and ROI. Optimize your marketing strategy by visualizing the effectiveness of your campaigns.

HR Dashboard

Monitor employee metrics, including headcount, turnover, and performance. Gain insights into HR activities and make data-driven decisions to improve workforce management.

Operational Dashboard

View operational data in real-time to enhance process efficiency. Track key performance indicators like production rates, inventory levels, and resource utilization.

Project Management Dashboard

Manage project timelines, resources, and progress with ease. Keep track of tasks, milestones, and budgets to ensure projects stay on schedule and within scope.

How Our Dashboard Services Work

1. Initial Consultation

We discuss your data sources and what you need to see in your dashboards.

2. Custom Design

We design dashboards in Looker Studio that show the metrics important to you, whether it’s for marketing, finance, or project management.

3. Data Integration

We connect your data sources like Google Sheets, BigQuery, and others for real-time updates.

4. Review and Refine

We fine-tune the dashboard based on your feedback to ensure it meets your needs perfectly.

Let's work together!

Fill out the brief contact form, and we’ll be in touch with you soon to learn more about your business.